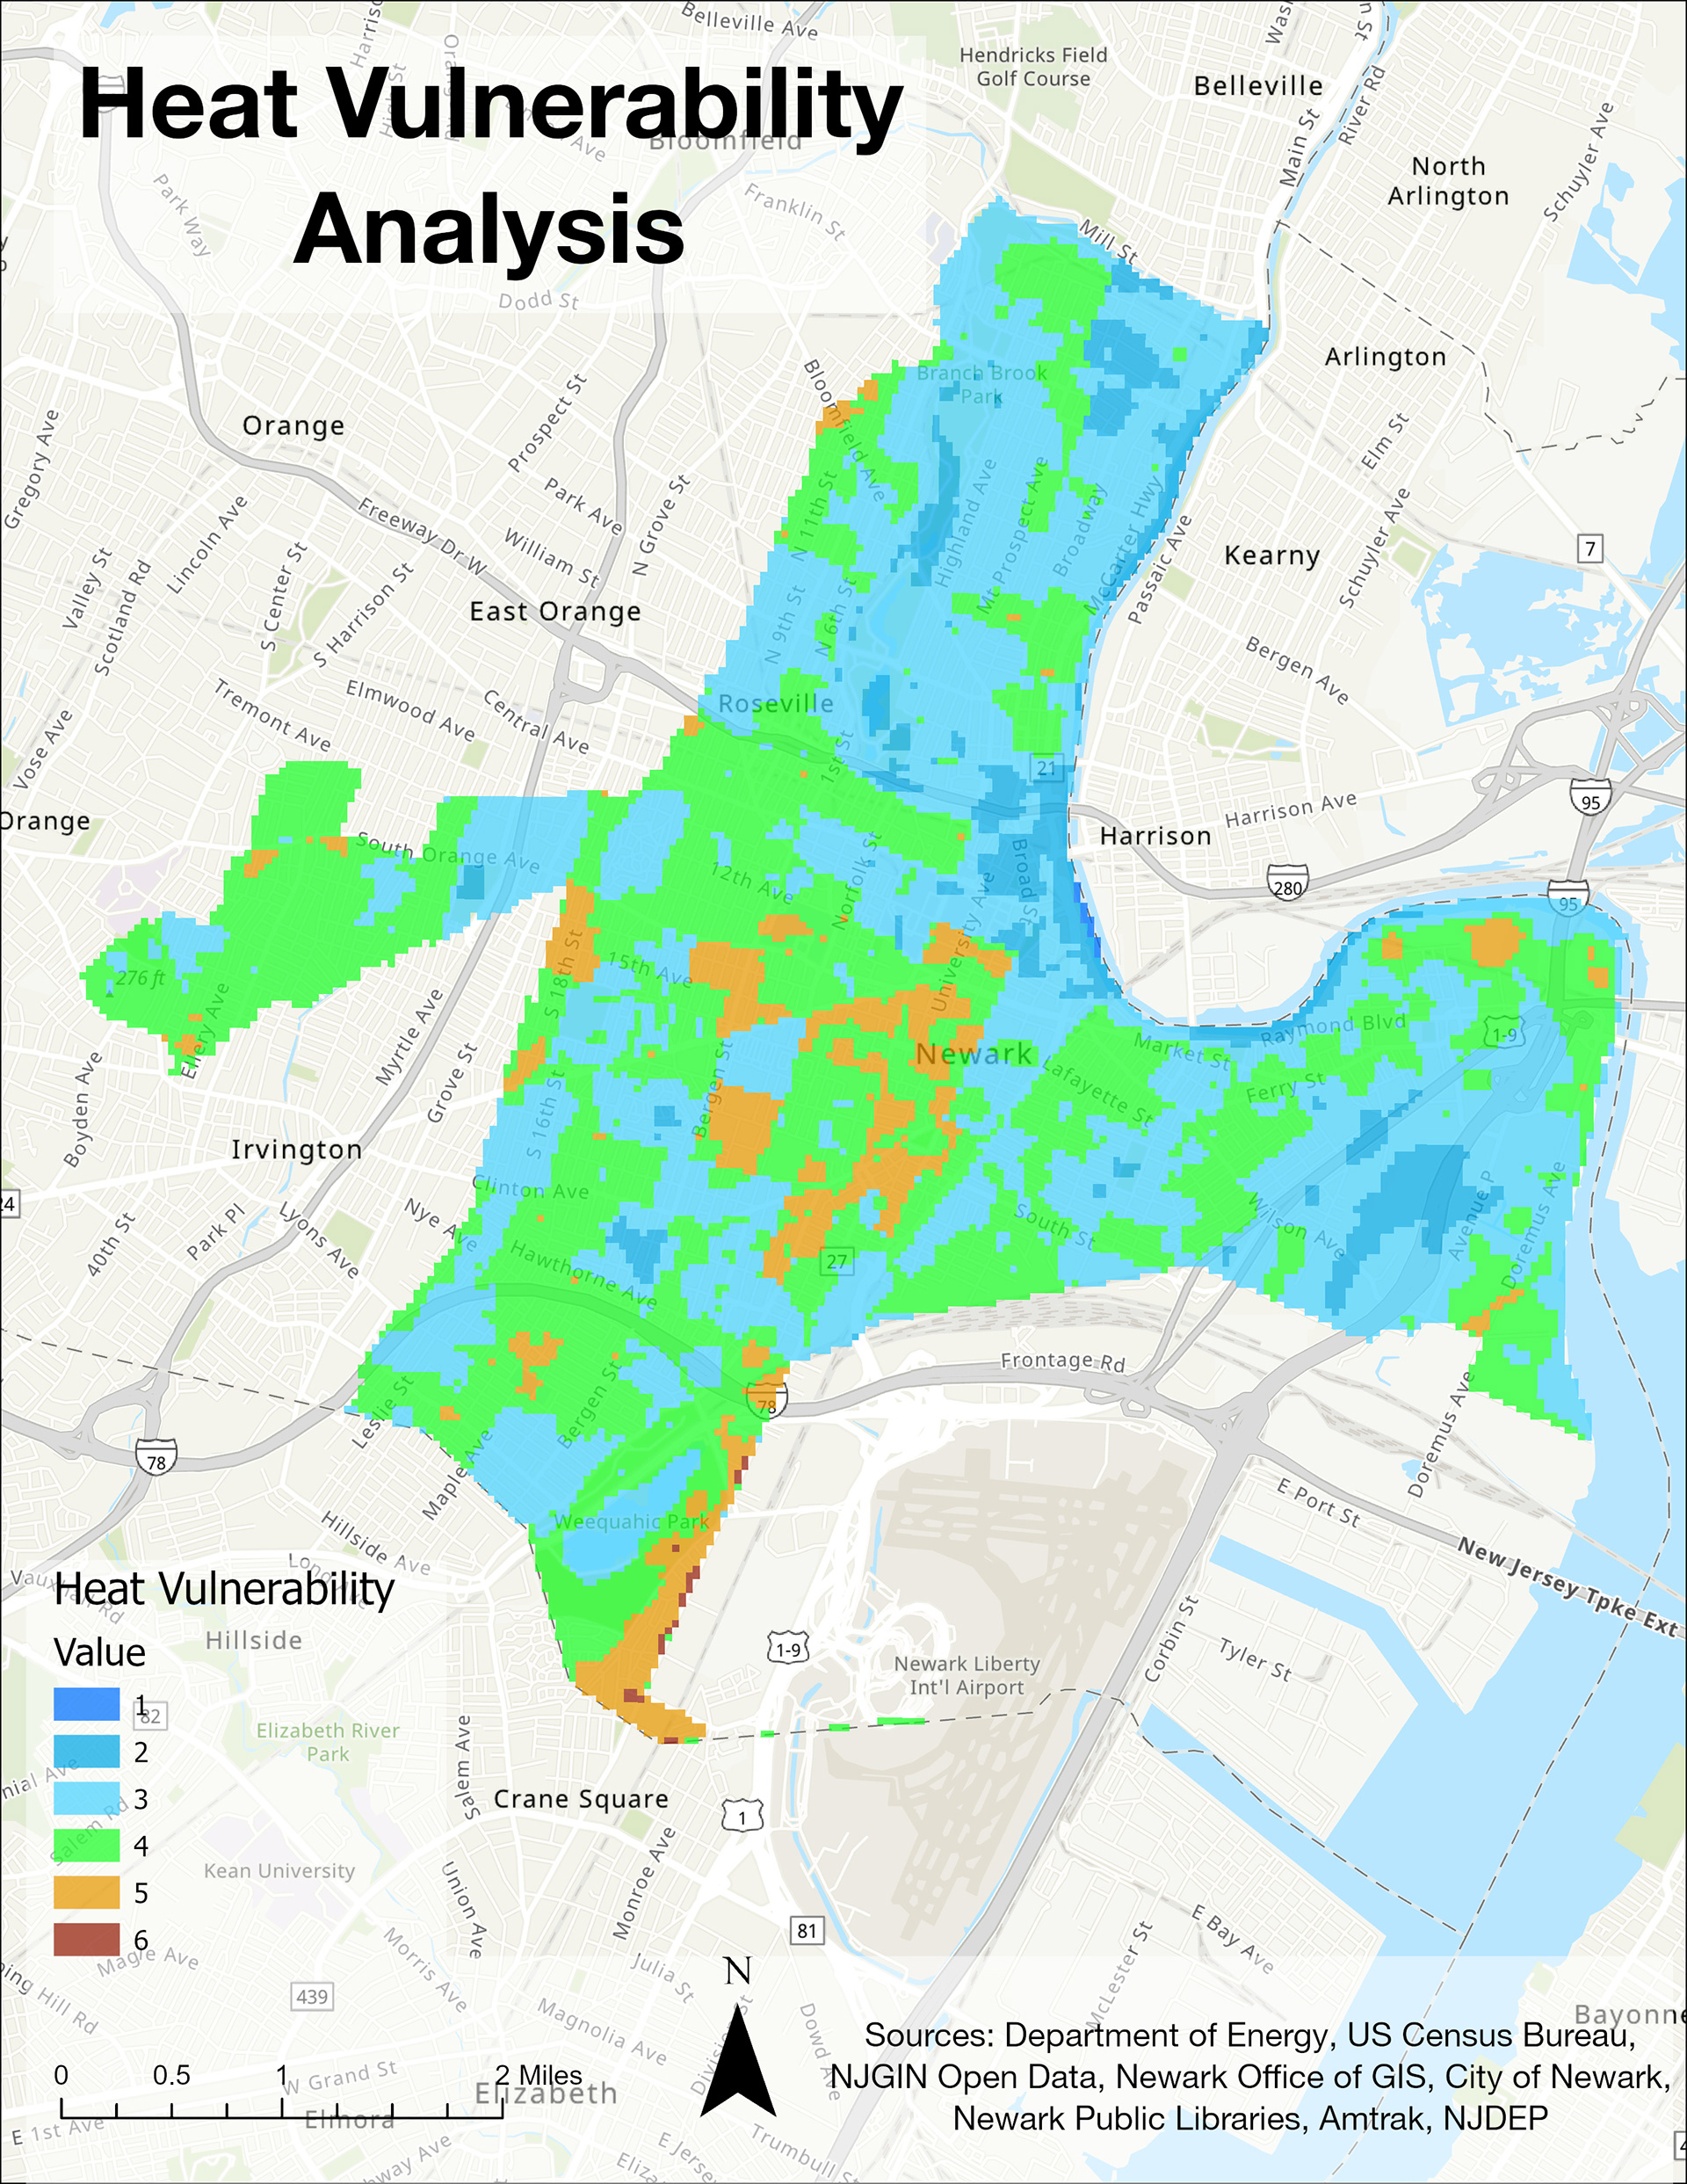
As climate change increases the frequency of hot days throughout the country, already vulnerable urban populations are at heightened risk from a combination of physical, social, and infrastructure factors. High rates of impervious, paved surfaces and lack of tree canopies can make certain neighborhoods particularly dangerous. I evaluated these combinations of factors to identify the most vulnerable areas of Newark, New Jersey during extreme heat events. I used data from the US Census and the City of Newark, surface temperature readings, and the locations of parks and green spaces to perform a multi-factor analysis. I formatted and layered the data on top of each other to rank the most vulnerable areas of the city.
My analysis showed that the most heat vulnerable areas are located in formerly redlined areas, far further from green spaces or cooling stations, and with high proportions of Black, brown, low-income, and older populations. The vulnerability analysis can be used by city officials to prioritize areas for proactive initiatives to implement green spaces and locate cooling stations.
